Answering Your Battlerite Questions With Pro Player Skywind555
06 Mar 2021
Introduction
This post assumes that you’re already familiar with the mechanics of the game.
Battlerite is a free-to-play Multiplayer Online Battle Arena (MOBA) brawler game available on Steam for those who are not familiar.
Here is a helpful resource for complete beginners. There’s also the Battlerite Wiki.
See my YouTube channel for sample gameplay footage.
The data I’m using is from the Battlerite API collected around July 11, 2019 right before API shutdown.
Details of how I collected the data from the API are available here for those interested.
For technical details of how I processed the data to be used in the analysis, go here.
For technical details of how I answered the first two questions in the analysis, go here.
For technical details of how I answered the last question, go here.
All the data and project files for this analysis are available in this repository.
Due to a relatively large data set with many columns, there is an endless number of questions to answer. However, the data is a bit outdated and covers only a day or two of games. It’s also from a previous patch and the beginning of a new season, so this means that any analysis results may not apply to the current state of the game.
Nonetheless, I came up with a list of possibly interesting questions that could be answered given the data’s limitations. I asked a handful of old and current Battlerite players which questions most interested them.
These focus questions are:
-
Does strict matchmaking actually improve the quality of matches?
-
How often do Triple DPS teams win against support teams in Solo Queue?
-
What are the most important features to determine the outcome of a round?
1. Does strict matchmaking actually improve the quality of matches?
For this question, only solo queue is considered.
Most players opt not to use the strict matchmaking feature because it increases an already long queue time. This holds especially true for higher-ranked players. In the end, does strict matchmaking really improve the quality of games?
First, how do we define “quality” in this instance? There could be three different ways to look at match quality.
-
How close are the matches?
-
How close are the rounds?
-
How spread apart are the players’ league ranks?
How close are the matches?
Was the game a 3-0 victory? Or was it a 3-1 or 3-2? The latter indicates that the teams were more evenly matched.
Because a 3-0 and 0-3 game is the same thing, we can say that a 3-0/0-3 game has a round differential of 3, a 3-1/1-3 has a round differential of 2, and a 3-2/2-3 has a round differential of 1.
As it turns out, if we look at games with at least one player who selected strict matchmaking, the average round differential is 2.15. For games with no players who chose strict matchmaking, the average round differential is 2.24.
The 95% confidence interval tells us that the true mean difference between the strict matchmaking group and the not strict matchmaking group is captured in the interval (-0.167, -0.019), with 95% confidence. The fact that this does not include 0 tells us that there is a significant difference between the strict matchmaking group’s mean round differential of 2.15 and the regular matchmaking group’s mean round differential of 2.24.
A significant difference means that 2.15 was not lower than 2.24 by random chance. So, this means that if we see the results for 1000 strict matchmaking games and 1000 regular matchmaking games, we will see more 3-1/1-3 and 3-2/2-3 outcomes with the strict group than the regular group because 2.15 < 2.24. In other words, strict matchmaking games on average have a higher proportion of 3-1/1-3 and 3-2/2-3 outcomes compared to regular matchmaking games.
How close are the rounds?
Does each round involve one team completely dominating the other one, or is it more evenly matched? Regardless of whether a game’s outcome is a 3-0/0-3, the rounds themselves can still be close. For example, both teams could be scoring high, and the rounds go to fog.
Here is some background information before examining a table that summarizes the differences between strict matchmaking games and regular games.
TotalDeaths measures the total number of deaths in a round.
NetTotalScore metrics calculate the difference between the score from a member on the team and the corresponding enemy player’s score.
1 refers to the highest-scoring player, 2 refers to the second-highest scoring player, and 3 refers to the lowest scoring player.
So, NetTotalScore1 measures the score difference between top scoring players for each side. The absolute value is taken, removing negative values.
“All” related rows calculate an average for the team and enemy to compute the value.
ScoreDamageRatio is defined as total score divided by damage taken. So, NetScoreDamageRatio1 calculates the difference between the ScoreDamageRatio of the highest-scoring player on each team.
ScorePerSecond is defined as total score divided by how long the player survived in seconds.
SD stands for standard deviation.
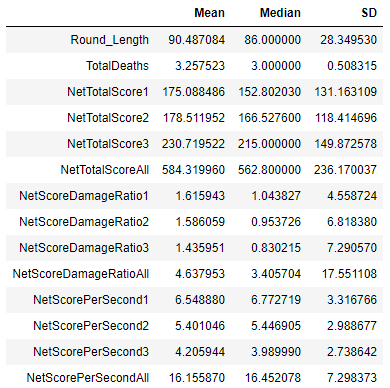
Here is the summary table for the strict matchmaking group.
Here is the summary table for the not strict matchmaking group.
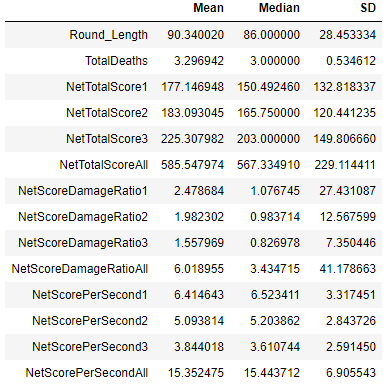
Below is the result of subtracting the second table from the first table. Negative values indicate that the regular matchmaking groups is higher for the respective metric.

For Round Length, 0.147 seconds is fairly insignificant. However, it does hold that rounds from strict matchmaking games, on average, are slightly longer than rounds from regular matchmaking games. It does not necessarily mean that more rounds go to fog in a strict matchmaking game. The negative SD value also shows that strict games are more consistent in the time in each round.
The TotalDeaths value is negative, indicating that more deaths occur in a regular game. This also implies that 1v1 and 2v2 situations happen less often in strict matchmaking games, which makes sense because there are fewer “weak links” to abuse from the other team.
The positive NetTotalScore3 value implies that the difference between each team’s lowest scoring player is bigger in strict games than in regular games. This is a bit counterintuitive, but NetTotalScore is not a good measurement to determine the closeness of rounds because it will vary depending on round length.
NetScorePerSecond metrics, in general, are not a great metric for determining the closeness of rounds. This is because higher values don’t mean one player or team is better than the other. For example, one player could be poorly utilizing their defensive abilities but landing all their damage abilities. This results in a quick death due to being focused by all players on the opposing team. But, their ScorePerSecond metric will be high.
However, damage taken with respect to score is a useful metric for determining the closeness of rounds. For example, imagine a 1v1 situation when both players take similar amounts of damage. In most cases, the surviving player will be closer to death. If that player is one hit from death, the immediate reaction is that it was a close fight. Though, not all scenarios with equal damage taken will result in that extreme of a situation because of the various sources of healing and true damage.
The nearly consistent negative values in the first two columns for NetScoreDamageRatio1, NetScoreDamageRatio2, NetScoreDamageRatio3, and NetScoreDamageRatioAll show that these values are larger in the regular matchmaking group. This illustrates that, on average, one team in regular matchmaking games is taking less damage than the other team while taking score into account.
This implies that players on both teams take more similar amounts of damage for how much they score for strict matchmaking games, indirectly showing that players are more evenly matched.
How spread apart are the players’ league ranks?
We should see all negative values in this table based on the way strict matchmaking works. Like the last table, NetLeagueDivision1 takes the absolute difference of their rank between each team’s top-scoring player.
For reference, placement counts as 0, Bronze 5 counts as 1, and going up to Champion 1 mapping to 30. The highest rank in the data was around Champion 3, so Grand Champion is omitted. Placement counting as 0 is not entirely ideal because a player’s skill level is always higher than Bronze League unless they’ve never played the game before. Because the data is during the beginning of the new season, players’ true skill isn’t measured properly.

The consistently negative values confirm that the ranks are more spread apart in regular matchmaking games.
2. How often do Triple DPS teams win against support teams in Solo Queue?
Often times in Solo Queue, whenever you see that you don’t have a Support while the enemy team does, your immediate thought is, “We lost, gg.”
But how often do they really win against Support teams? Does it differ by League, Map, Team Comp, or Enemy Comp? Going a step further, how do they commonly win rounds?
Overall, Triple DPS teams’ win rate against a team with at least one Support is about 44% in a sample size of 370 games.
By Map
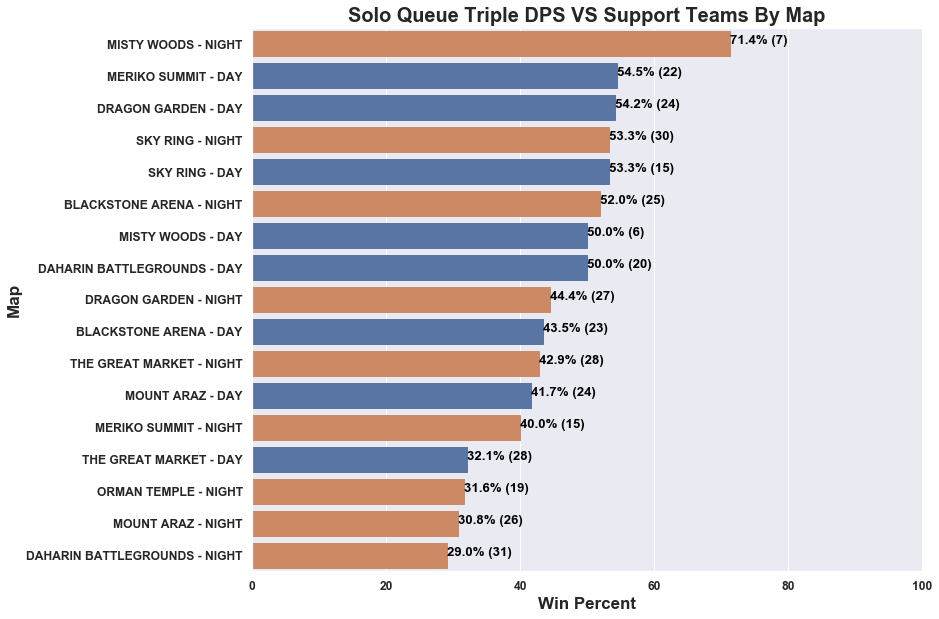
The best map is Misty Woods - Night resulting in a 71.4% chance to win, although the sample size is much lower than most other maps. Meriko Summit - Day, Dragon Garden - Day, Sky Ring - Night, Sky Ring - Day, and Blackstone Arena - Night are strong contenders with all win percentages > 50%.
Daharin Battlegrounds - Night, Mount Araz - Night, Orman Temple - Night, and The Great Market - Day are the worst maps with win percentages < 40%.
As far as why these maps are better/worse than the other maps is not entirely clear as it can also be dependent on Team Comp versus Enemy Comp.
It may also be due to chance due to a relatively low sample size and slight bias. This is because high-rated players tend to avoid playing triple DPS whenever possible.
By League/Elo
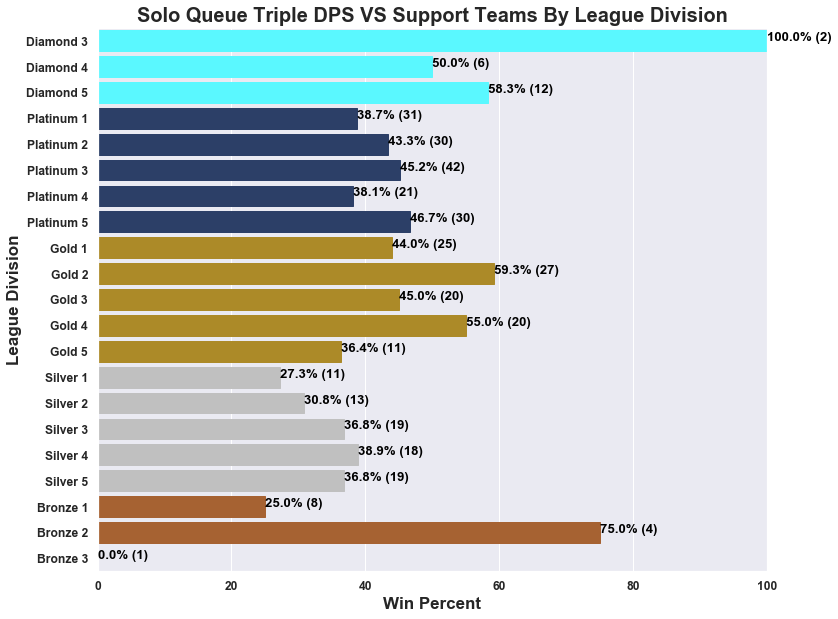
Again, due to the low sample size, the results above are not too clear. It seems that a Triple DPS team averaging Diamond League has the best chance to win because they understand the game better compared to lower league players. They know how to properly punish players for their mistakes, whereas a lower-rated Triple DPS team may not be playing aggressively enough to take down a team with a Support.
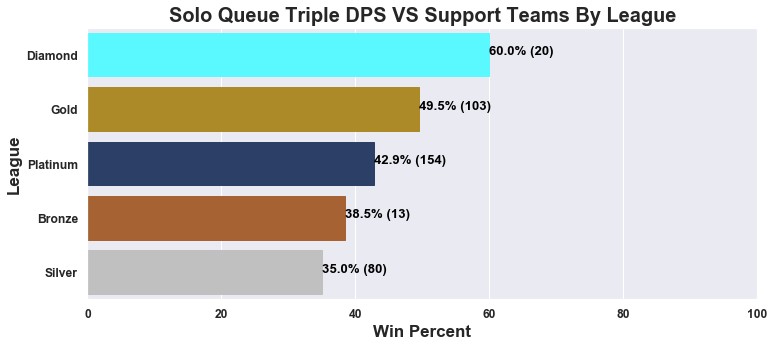
Similar to the last plot, this shows that Triple DPS teams averaging Diamond League have the highest chance to win. Keep in mind that this is the beginning of a new season, and players in Diamond League will be closer to Grand Champion in skill level.
Bronze and Silver are consistently at the bottom, which makes sense because they haven’t learned how to play the game properly yet.
It is somewhat strange that Gold League performs better than Platinum League. I don’t know the major differences between the players in these lower leagues, so I can’t say why this happens to be the case.
By Team Role
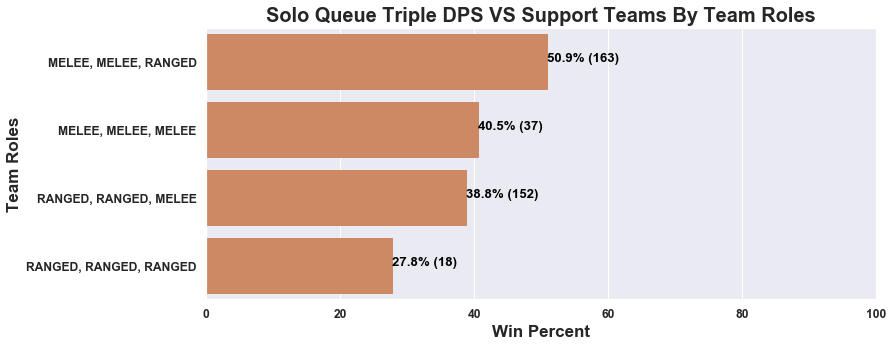
The plot clearly shows that the best Triple DPS comp consists of two melee champions and one ranged champion. The worst is Triple ranged. The smallest sample size also reflects this because not many people will intentionally pick a bad comp.
By Enemy Role
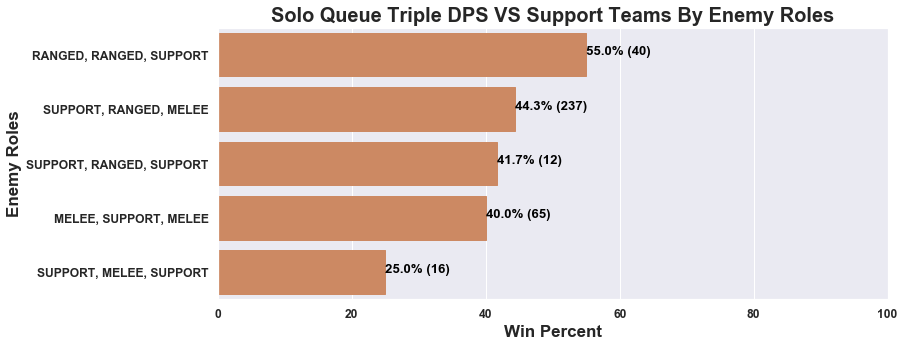
Triple DPS teams appear to perform best against double Ranged Support teams and the worst against double Support Melee.
This may be due to the fact that double Melee Ranged is the most common triple DPS comp, and from a comp perspective, that should perform well against a double Ranged comp regardless of actual champions.
Double Melee comps can push double Ranged comps back for mid control. It may also be more deadly for the enemy team if their Support is a melee Support such as Ulric or especially Sirius because it puts them at the frontlines. We know about that Space Q Sirius syndrome.
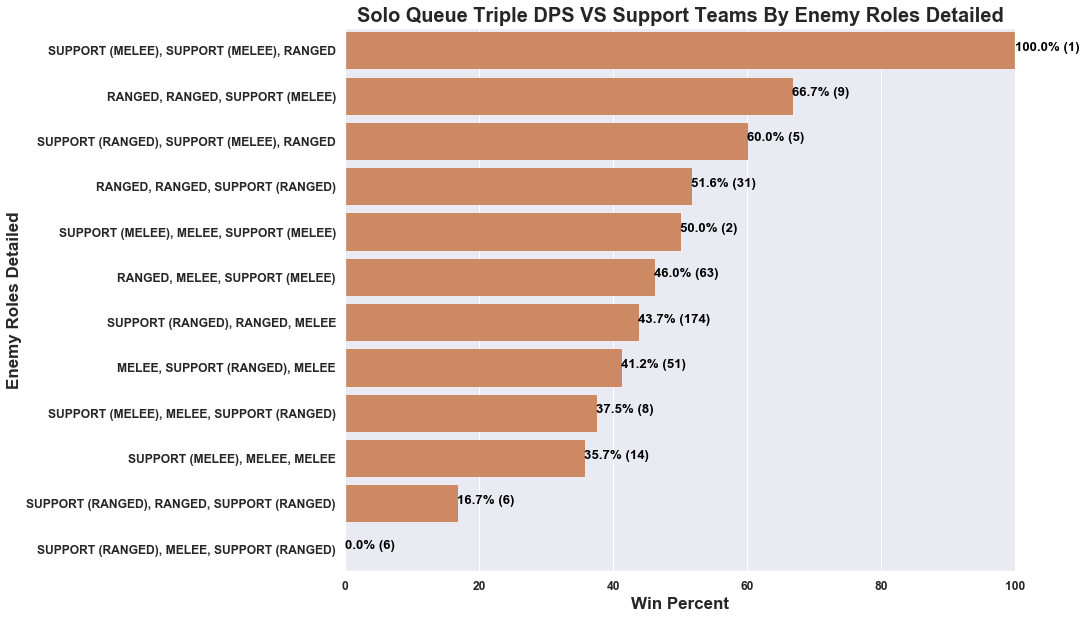
There are quite a few groups with low sample sizes, particularly the different double Support + DPS combinations. Universally, everyone understands that the best comp is a balanced comp containing one Melee, one Ranged, and one Support champion. The Melee champion creates space for the Ranged champion to be more effective, and the Support champion provides protection.
When one or more roles are missing, certain weaknesses become apparent. For example, if there’s no Melee champion, the team will continuously be shoved back and have no mid control. In most cases, people don’t try to pick an unbalanced comp with the well-understood notion that it doesn’t perform well. Usually, when they happen, players who only play one hero happen to land on the same team.
Our top result with 100% win rate only has one game, specifically against Ulric, Sirius, and a Ranged champion. Comp wise, I can tell you that this is not a good comp. It’s more optimal if one of Sirius or Ulric was swapped out for a Melee DPS champion. This allows the Sirius or Ulric to utilize their space ability to follow the melee ally after they jump in to heal their partner and pressure the enemy. Still, the victory against this team could have happened by random chance.
In general, we can’t draw any conclusions about the low sample groups despite that it appears that Triple DPS does well against Ranged, Ranged, Support(melee) and bad against Support (ranged), Melee, Support (ranged) and Support (ranged), Ranged, Support (ranged).
Specific match-ups could have caused the result of any of these percentages. Comp match-up contributes a great deal to whether or not your team can win a round or game. A bad comp means that you have to severely outplay your opponents to win, which doesn’t happen in most cases.
Because there are many different Triple DPS comps combined with the different double Support + DPS comps, one specific match-up might be over or under-represented. For example, a triple Ranged DPS comp will undoubtedly do poorly against Oldur, Pearl, and Shifu.
Without examining the exact comp match-ups against each combination of double Support + DPS, we can’t generalize anything about Triple DPS win rate against them. And if we were to split it up that way, we would only likely have a few samples within each group because the sample sizes are small, and the results of those match-ups could have been attributed to random chance.
With the single support combinations, Triple DPS performs the best against Ranged, Ranged, Support (ranged) with a win percent of 51.6%. Considering that the overall win rate for Triple DPS is 44%, this is very good. Going back to our previous discussion, this makes sense because of the lack of forward pressure and being shoved back, consequently losing mid control.
On the other hand, Triple DPS performs the worst against Support (melee), Melee, Melee within the single Support combinations. I see this working because they will aim to rush down the Triple DPS team’s Ranged champion. Since they have no Support, the Ranged champion should not be able to survive. Since most Triple DPS comps contain at least one Ranged champion, seeing a low win percentage for this is not surprising.
How do Triple DPS commonly win rounds against Support teams?
Is the optimal strategy to control mid, play for hp, and wait until fog before killing the enemy? Is it better to go all-in right from the start? Is it better to kill the Support champion first?
Well, that’s always going to depend on the comp match-up and the situation, but this part of the analysis hopes to determine what’s different between winning and losing rounds of Triple DPS teams compared to winning and losing rounds Support teams.
In any given round, the first death often sets the tone for the rest of the match. Typically in a 2v3 situation, the disadvantaged side loses. Triple DPS teams win 11.7% of the rounds when the round’s first death is on their side. For Support teams, this number is 11.1%, 0.6% lower, which is not a big difference. It makes sense that it would be higher for Triple DPS because with two DPS champions remaining, they are still capable of dishing out plenty of damage compared to if the Support team lost one of their DPS champions.
Here is some background information before examining two tables that show the differences between Triple DPS teams and Support teams. Note that for Triple DPS, only match-ups against Support teams are considered. For Support teams, only match-ups against other Support teams are considered.
All values in the table are mean values for each metric representing the average for the associated group in a round.
First Death Traded represents the mean percentage of rounds when there is a trade associated with the first death. A trade means that a player died and within five seconds, another player from the opposing team died.
Any Trade represents the average probability of rounds when at least one trade happened throughout the round.
First Orb represents the average probability of the time the team secured the first mid orb.
Net Orbs represent how many more orbs on average the team secured compared to the enemy team.
Round Length represents the average time passed in a round in seconds.
Enemy1 Death represents the average time it takes to kill the first enemy.
Enemy1 Support represents the average probability that the first enemy killed is a support champion.
Enemy2 Death represents the average time it takes to kill the second enemy after the first enemy’s death.
Enemy2 Support represents the average probability that the second enemy killed is a support champion.
Enemy3 Death represents the average time it takes to kill the third enemy after the second enemy’s death.
Enemy3 Support represents the average probability that the third enemy killed is a support champion.
The above four values are only computed for winning rounds. Also, note that the percentages for Enemy1 Support + Enemy2 Support + Enemy3 Support are not supposed to add up to 1 since there can be more than 1 Support on a team.

The table above assumes that the first death occurs on the team side, so a disadvantaged 2v3 situation.
In a round when someone from your team dies before the enemy team, it’s clear that Triple DPS teams will be making a trade 42.7% of the time for winning rounds. Comparatively for Support teams is only 27%, about 15% lower.
Comparing the difference between winning rounds and losing rounds for this metric shows that for Triple DPS teams, the First Death Traded is about 37% (43% - 6%) higher for winning rounds, and for Support teams is about 23% (27% - 4%) for winning rounds. This shows that it’s much more critical for Triple DPS teams to get a trade on the first death than Support teams.
The average probability of Any Trades happening in the round, average probability of taking the First Orb, average Net Orbs for Triple DPS teams are higher than Support teams for winning and losing rounds. When examining the differences in percentages between winning and losing rounds, we see that Triple DPS teams have a 40% (52% - 12%) difference for Any Trades while Support teams have 26% (35% - 9%) difference.
Combining this observation with that Triple DPS teams’ winning round metrics are higher than Support teams’ winning rounds, the importance of trades is key with Triple DPS teams. This makes sense because, without a healer, deaths are more likely, but it makes it more worthwhile if you can bring an opponent down with you.
Triple DPS teams are more likely to take the First Orb than Support teams. This is reasonable because Supports tend to have low damaging abilities, making it harder to secure the orb. The effect of the First Orb is vital for both groups. If we compute the differences between the winning and losing rounds, we see that for Triple DPS teams, this comes out to be 13% (63% - 50%), and for Support teams, this is 12% (52% - 40%). The difference between this is only 1%, so a very negligible difference.
Rounds on average are shorter when Triple DPS teams win compared to when Support teams win, indicating that the best general strategy for Triple DPS teams is to end rounds as soon as possible, not allowing the enemy team to reset and heal up. The data in the Enemy1 Death column supports this.
Winning rounds for Triple DPS teams involve killing the first enemy about 60 seconds into the round. Losing rounds, on average, takes about 4 seconds longer. Since orbs spawn in about 21 seconds between each orb, this shows that Triple DPS teams aim to use the advantage from likely the first two orbs to kill the first enemy.
It’s interesting to see that the opposite is true for Support teams. In their losing rounds, the time to kill Enemy1 is lower compared to the winning rounds. This may indicate that playing overly aggressive is not optimal for Support teams.
If we examine the Enemy1 Support row, we note that killing the Support first is more common in losing rounds than winning rounds for both Triple DPS teams and Support teams. So, in general, it’s better to kill a DPS champion before focusing on the Support champion, at least for rounds when the first death is on the team side. The effect is more important for Triple DPS teams. If we calculate the difference for Triple DPS teams, we get -7% (32% - 39%) and for Support teams we get -2% (35% - 37%).
The Enemy2 Death column shows the average time passed since the death of the first enemy. For Triple DPS teams, this number is lower than Support teams, indicating that they should capitalize on more momentum following the first enemy’s death.
For Support teams, the death of the last enemy is lower than the previous. However, for Triple DPS teams’ winning rounds, it’s actually increased. This makes sense because due to the high probability of trades happening, there is a good chance that the last enemies standing are in a 1v1 situation. Whereas when teams with a Support champion are less likely to be put in that situation and the last enemy standing will be against two players on the other side, making the round faster to end.

The table above assumes that the first death occurs on the enemy side, so an advantaged 3v2 situation.
When the first death is on the enemy side, most of the previous table patterns stay the same. In winning rounds, Triple DPS teams’ metrics are higher for First Death Traded, Any Trade, First Orb, and Net Orbs while they are lower for most others compared to Support teams.
Enemy3 Death for Triple DPS winning rounds is now lower than the previous, which makes sense because now they are less likely to be put in a 1v1 situation because the first death is on the enemy side, making it a 3v2 instead of a 2v3.
In contrast to winning rounds when the first to die is an ally, it’s common sense that you don’t want to trade your first death, so we see relatively low values under First Death Traded and Any Trade compared to the first table. First Orb and Net Orbs remain essential for both groups.
The time it takes to kill the first enemy is significantly lower in both groups. For Triple DPS teams, this should be around the time to spawn the second orb assuming that the first orb is taken almost immediately upon spawning. So, the effect of taking the orb to kill the first enemy is seen more clearly here.
Enemy1 Support sees a higher rate in this table than the first table, and the same patterns hold true. It’s better on average to avoid killing a Support champion first. Practically, this won’t always be true. For example, if the other two DPS include a Shen Rao and a Taya while you’re playing as Varesh, it may not be optimal to try to go for DPS in this case.
3. What are the most important features to determine the outcome of a round?
We all know how crucial mid orb is, but how much of a winning effect does it have across a typical round? How many green orbs does it take to achieve the same effect? What has the highest impact on winning the round out of Damage, Control, Protection, or Damage Taken? How much of an impact does the weakest link on a team have on winning?
These types of questions will be addressed.
Because 2v2 and 3v3 are entirely different game modes in terms of general gameplay, I separate these into two distinct data sets.
The outcome of a round is a binary response, a 0 (loss) or a 1 (win), so I’ll use logistic regression to build a statistical model. I use this model-building strategy outlined in chapter 4 to build the model.
Since the results of the model are a bit convoluted, I’ll highlight the most significant findings.
-
Ping impacts games in 2v2 more than 3v3, but in the big picture, ping differences between players of two teams does not help much in determining whether one team wins the round. We all know ping matters a lot, but this conclusion is valid because the sample of games is in a non-tournament context. Someone with high ping could easily beat a lesser-skilled player with good ping. Averaging all the games’ effects shows that ping alone doesn’t help determine whether you win or lose a round.
-
Considering only individual metrics and no information about allies and enemies is not enough in determining a round is won. Information about ally performance and enemy performance is needed. This means that looking at raw score values for one person is not enough to determine a round is lost or won. Though, this should be common sense because one person’s performance can’t be used to determine whether a round is won or lost across all games.
-
The difference in the amount of Energy Shards picked up between two teams does not matter for both 2v2 and 3v3.
-
The effect of taking one mid orb is approximately worth three Health Shards for both 2v2 and 3v3. This may not make much sense because one Health Shard is 6 hp true hp, 6 recovery hp for one person, while one orb means 10 true hp and 10 recovery hp for the entire team plus 25 energy. It may be due to that taking the mid orb often is not “free.” This means that teams will expend energy and receive damage as a trade-off to secure the orb, while taking a Health Shard is much simpler.
-
Out of Damage done, Damage Received, Protection, Protection Received, Control, Control Received, and Energy usage, differences in Damage Received and Protection between players of two teams are most important. Differences in Damage done for each team’s lowest scoring player have some minor effect in 3v3, but not 2v2. Otherwise, the differences in Damage Received and Protection are most critical in 2v2 and 3v3.
This observation may be due to that simply doing damage is not enough. For example, one team’s highest-scoring player might do a ton of damage, but no true damage. Meanwhile, the highest-scoring player on the other team may do less damage overall. However, he synergizes well with other team members, and they all stack damage onto one enemy player. Then, that enemy player will have received more damage than his counterpart.
It may seem that Damage done and Damage Received should be the same thing but reversed, but that is not the case as seen in the above example.
Protection score includes healing but also the value of shields. That also plays into true damage, so naturally, the differences in this metric are important for all team members, even the DPS characters.
Conclusion
1. Does strict matchmaking actually improve the quality of matches?
Yes - there is a higher proportion of 3-1/1-3 and 3-2/2-3 match scores when strict matchmaking is selected versus when it’s not. Players are also more evenly matched within the game.
2. How often do Triple DPS teams win against support teams in Solo Queue?
Triple DPS wins 44% of the time versus Support teams overall. Melee, Melee, Ranged has the highest win rate out of the Triple DPS combinations. Within teams with only one support, Triple DPS teams perform best against Ranged, Ranged, Support (ranged), and the worst against Melee, Melee, Support (melee). Triple DPS teams should not be afraid to commit for kills because even winning rounds involve a high chance of trading kills.
3. What are the most important features to determine the outcome of a round?
Negative differences in Damage Taken between players in your team versus the enemy team and positive differences in Protection between players in your team versus the enemy team is most important in determining a round’s outcome. In other words, minimizing Damage Taken and maximizing Protection values is most important.